Our Projects
Individual Student investigations into different topics using Data
WA K-12 School Funding Dashboard
An interactive data dashboard analyzing school funding disparities across all 295 Washington districts. Compare per-student spending, explore demographics, and understand where education dollars go.
By: William Yoon | 12th grade
Explore the Dashboard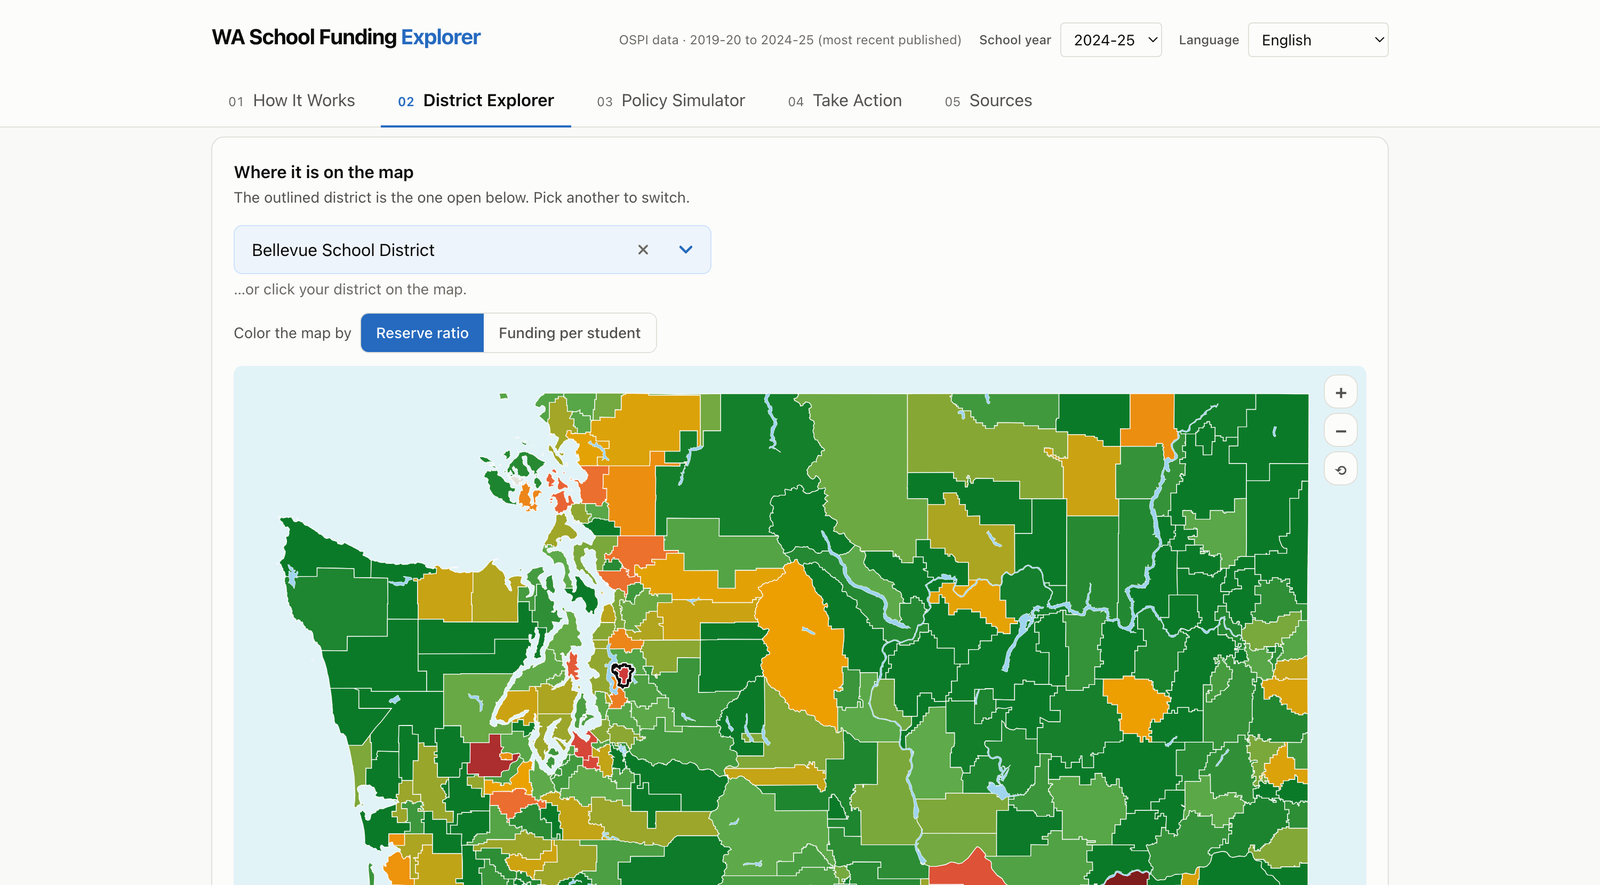
Arts Education Inequalities in the Puget Sound
A research presentation on unequal access to arts education across King County and Washington State. It traces how gaps by income and race persist statewide and nationally. The project also discusses short and long term fixes to this inequality from masterclasses, mentorship programs, and more designed specifically for Title I elementary students.
By: Jed Kim | 11th grade
View the Presentation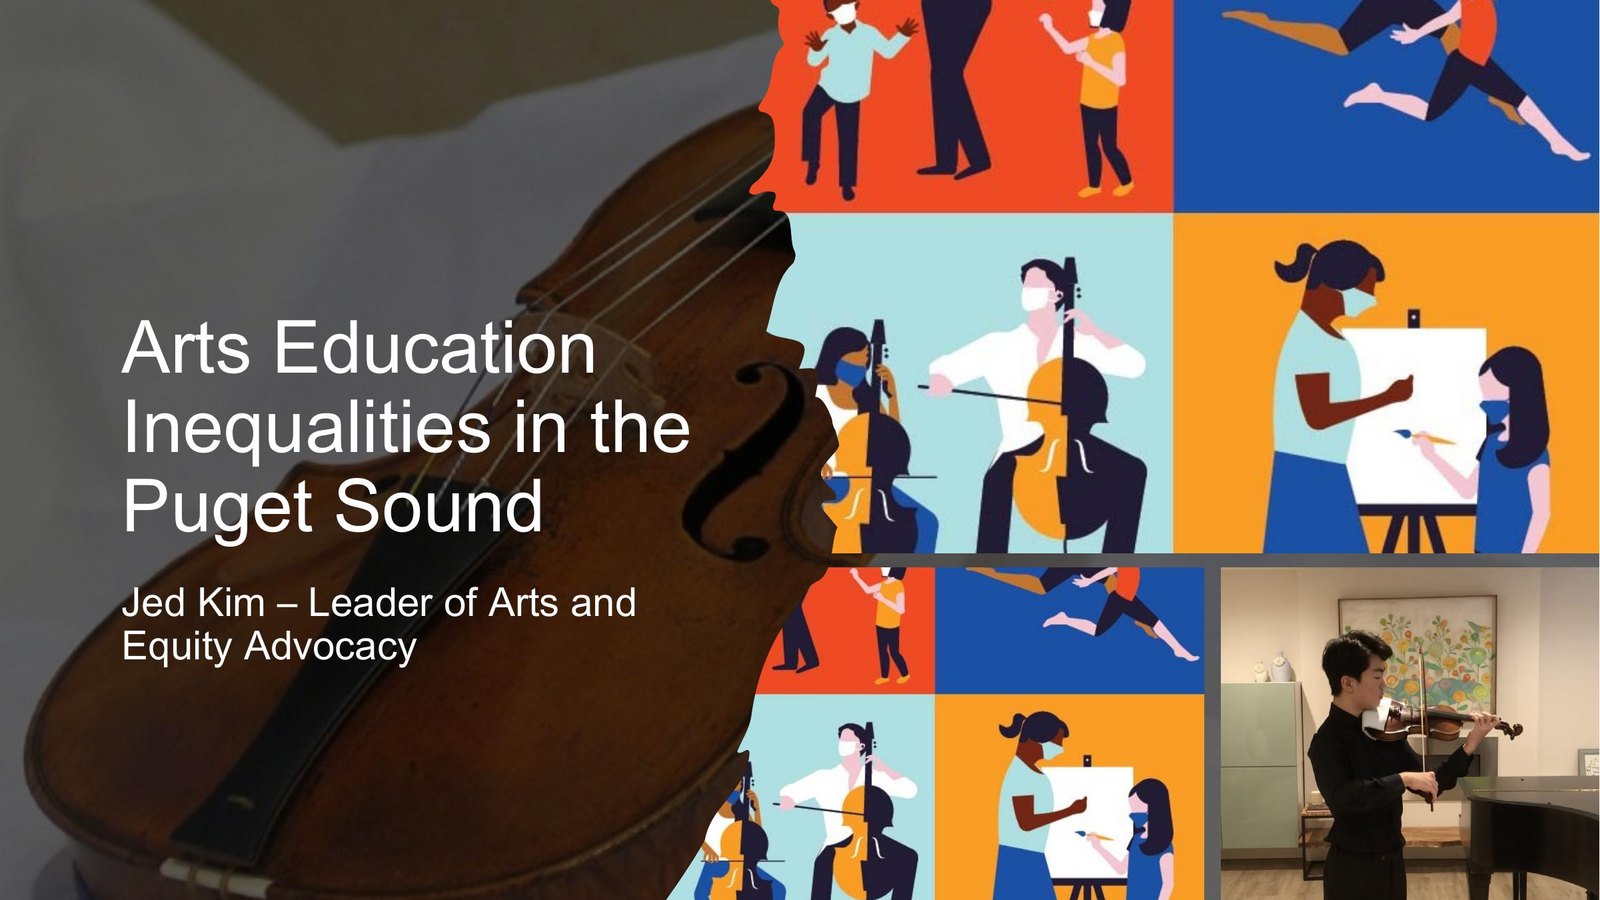
Understanding Gun Violence
A data-driven overview of gun violence as a public health issue. The project discusses what it is, how its categories differ, what federal mortality data shows about the long-term trend, and how communities respond through education, intervention and civic engagement.
By: Mark Yu | 9th grade
View the Presentation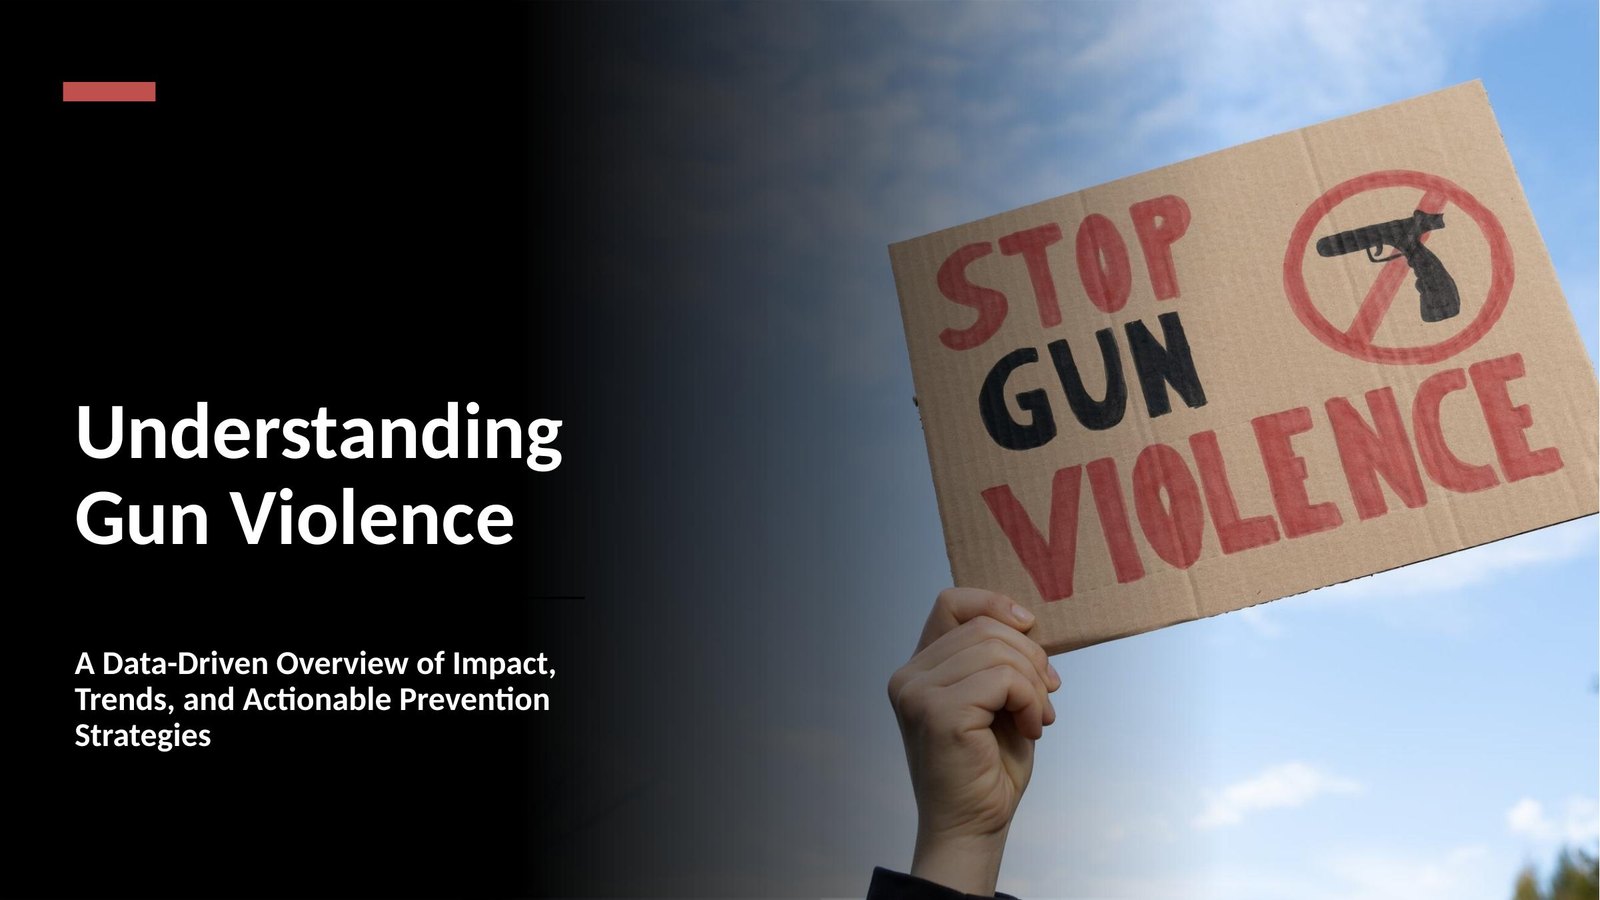
Private – Public Pipeline
A look at how people and money move between the private sector and government, and what that movement does to federal contracting. It covers lobbying and PAC spending, the revolving door between Congress and the defense industry, and how non-competitive contracts and a shrinking pool of major contractors lead to overcharging on the Pentagon budget.
By: Stanley Song | 11th grade
View the Presentation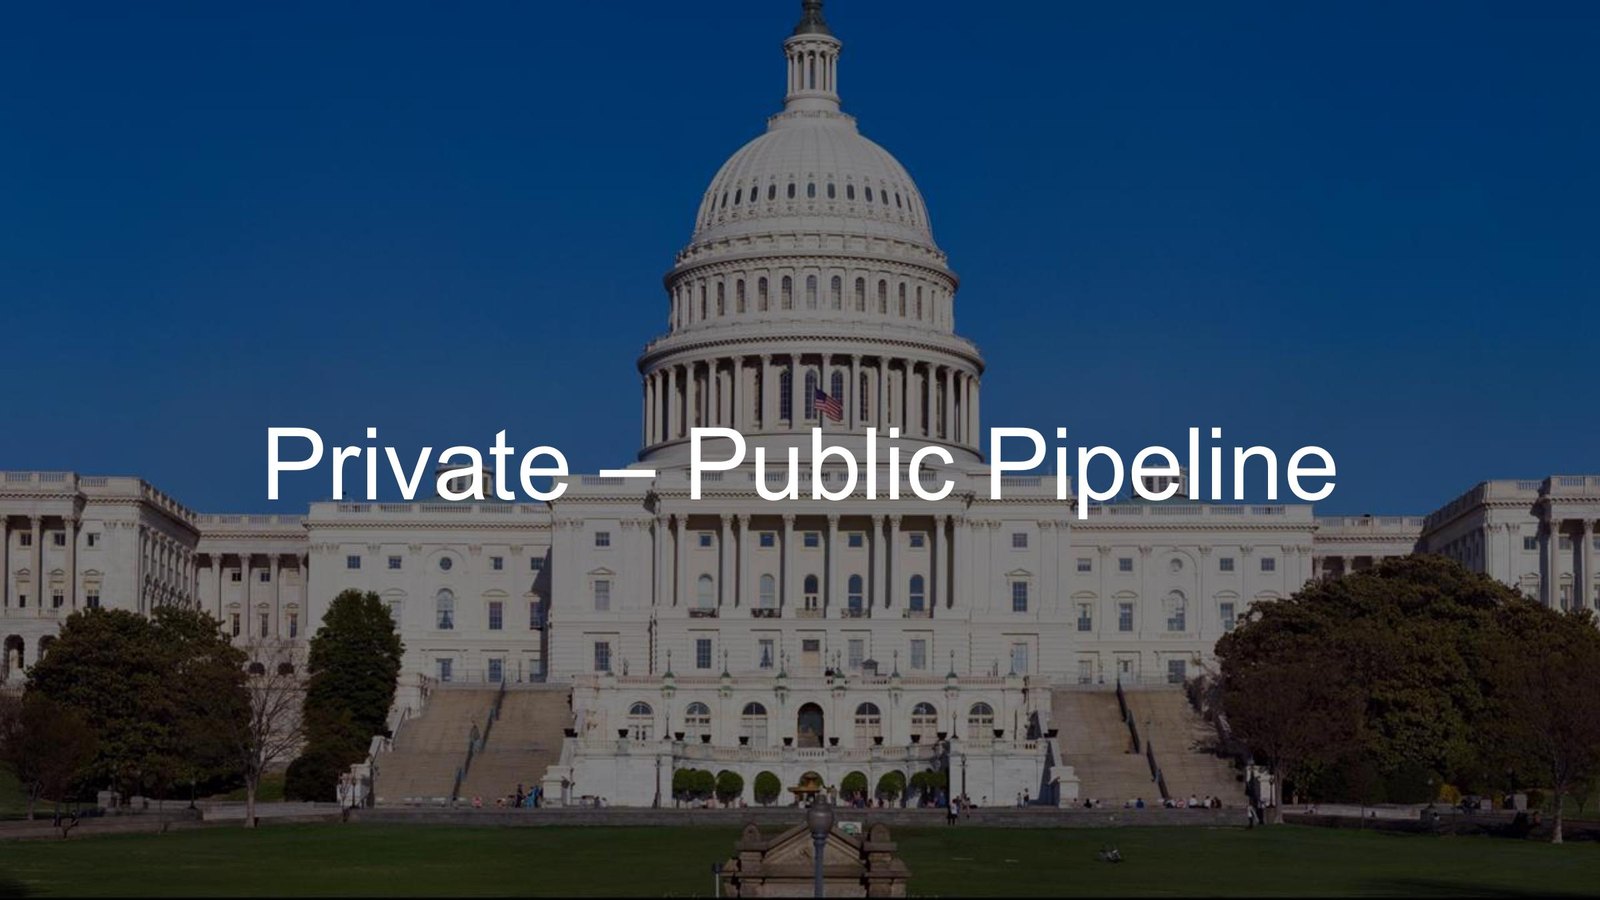
Unemployment
An overview of unemployment: how it is defined and measured, and what drove the major spikes from the Great Depression through COVID-19. It compares Seattle and Spokane to show how a tech-driven economy and a seasonal one produce very different patterns, breaks the rate down by demographic group, and looks at unemployment insurance, retraining programs and steps for the future.
By: John Kim | 9th grade
View the Presentation
The Downfall of Air Quality
A look at why air quality in Washington has worsened, built around the Air Quality Index and the wildfire smoke that drives the state's worst PM2.5 days. It traces clean-air policy from the 1970 Clean Air Act onward, compares Spokane and Seattle across recent wildfire seasons, and covers burn bans, monitoring and what individuals can do.
By: Sean Kim | 5th grade
View the Presentation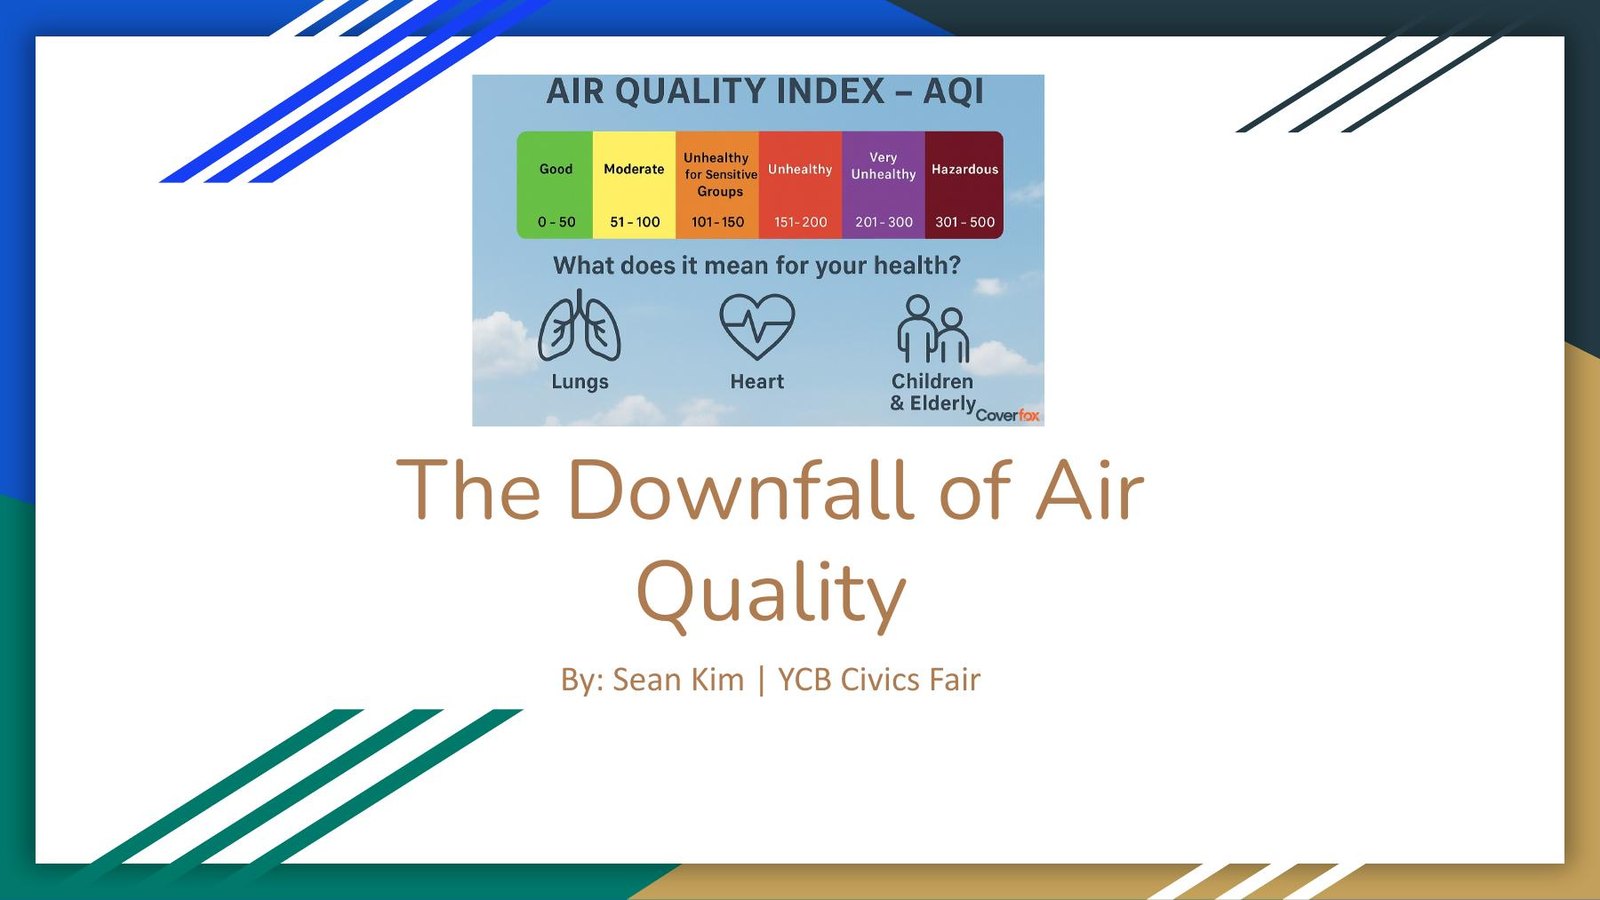
The Current Issue with Climate Change
An introduction to climate change: what it is, why it matters, and how the science and policy developed from the first measured warming signal through the IPCC, the Kyoto Protocol and the Paris Agreement. It uses global temperature and sea level data to show the trend, then covers what is being done now and steps for the future.
By: Hyein Ah
View the Presentation
Want to build your own project?
Join YCB and turn your understanding of policy and data into real civic impact.
Join Youth Civic Bridge